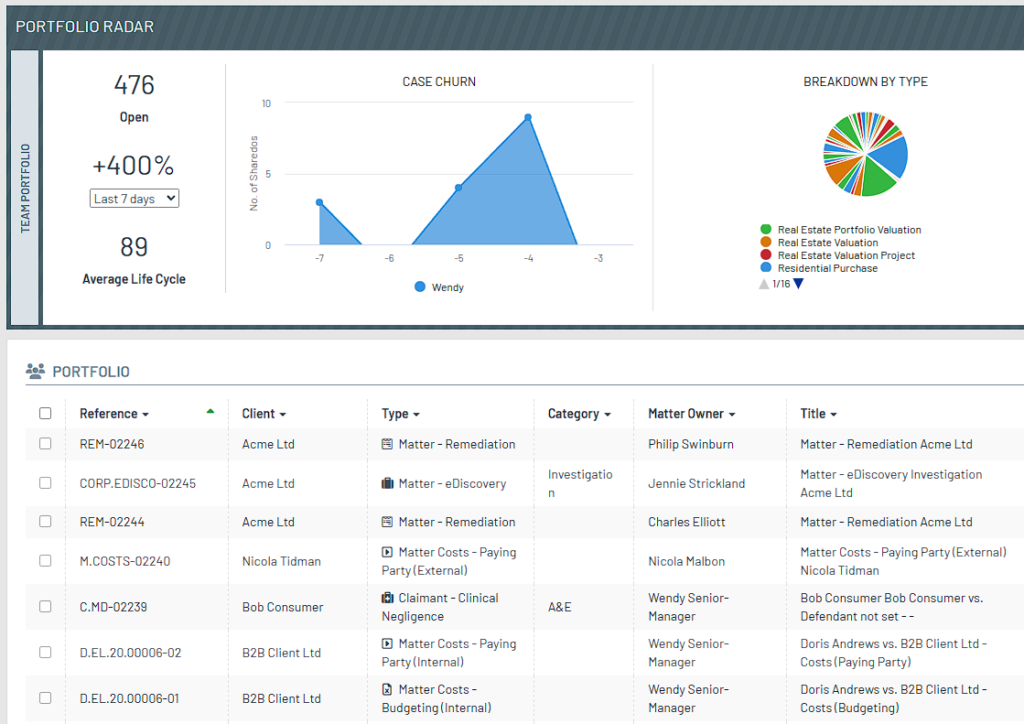
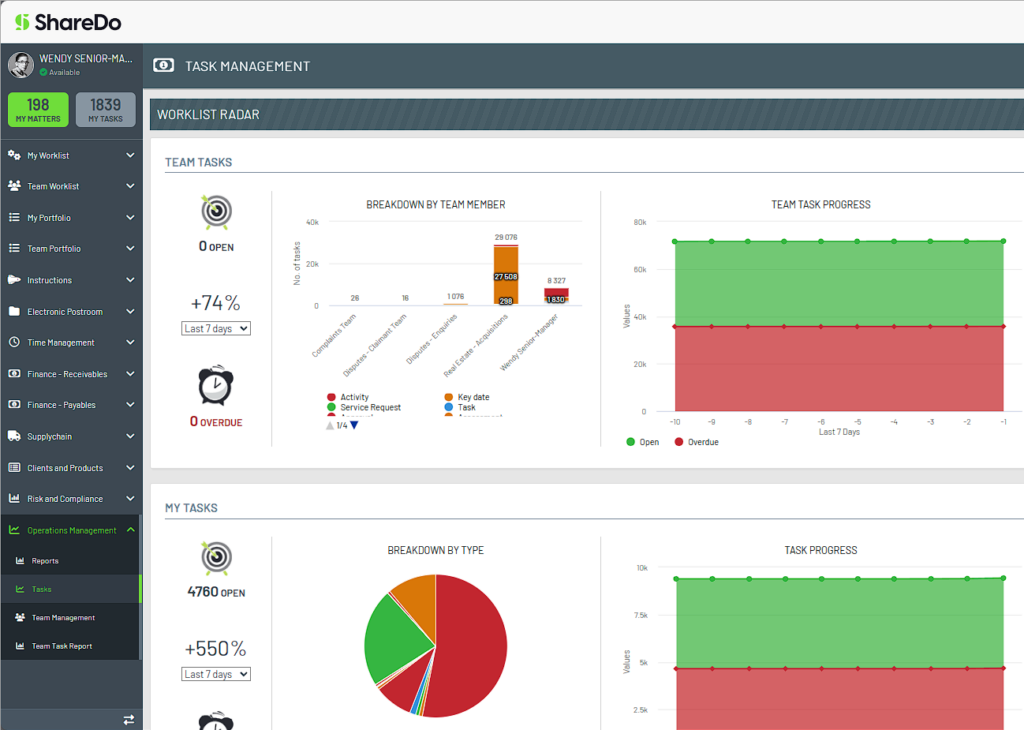
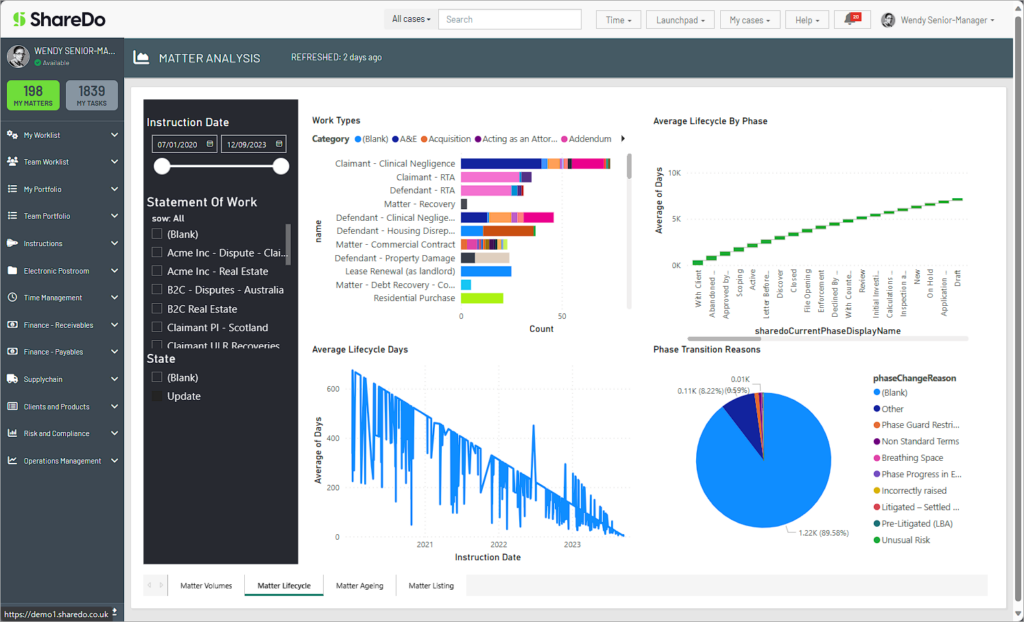
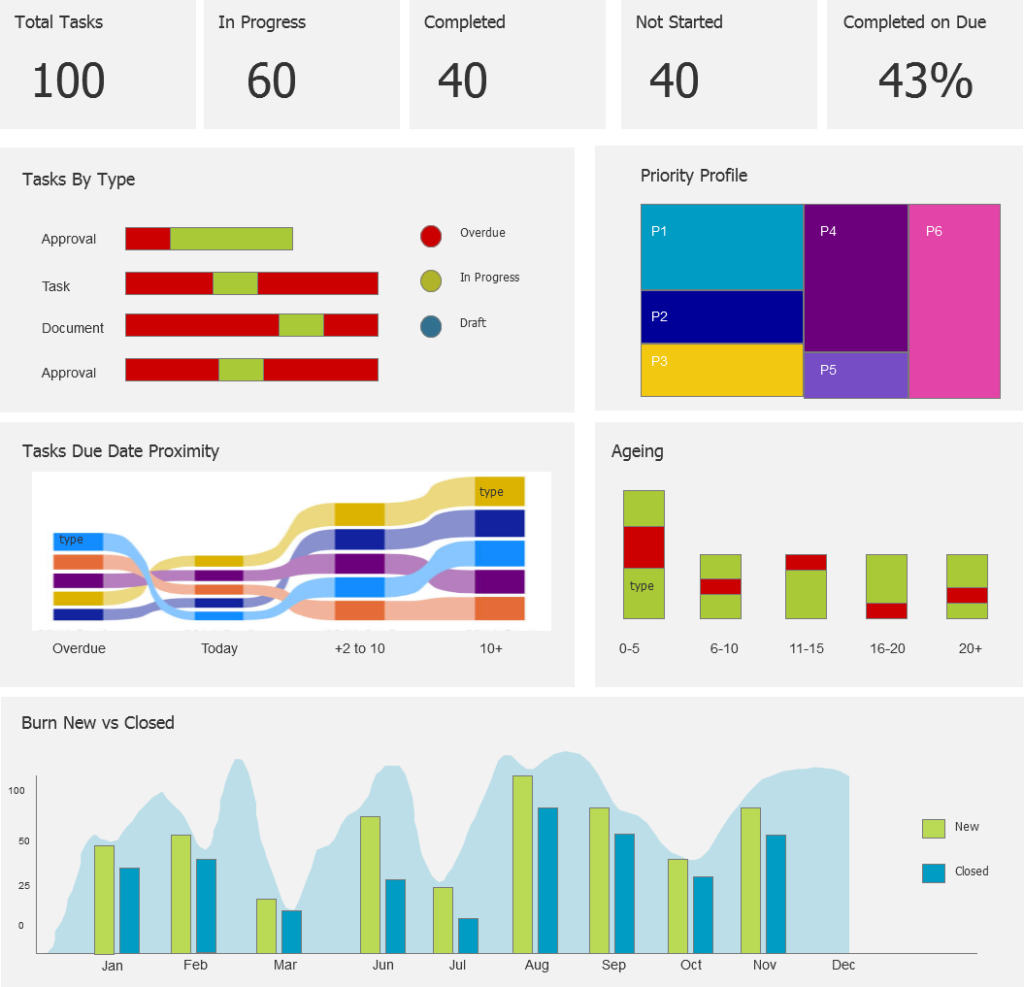
Nearly every action taken on the ShareDo system is captured in your data warehouse. You can use this data for near real-time insights, while keeping sensitive information secure. Using a snowflake schema design, the data warehouse can be reported on either natively, via any SQL-compliant tool, or through our PowerBI integration.
It’s not just senior staff and managers that need reports. Users also want to track progress toward their goals and maintain visibility on the metrics that matter.
When creating custom screens you can use the widget builder to embed any reports you wish, and show contextually relevant information for the user depending on who they are and where they are in the system.
For example – data reports shown on a case overview page should be different to data reports shown on that specific case’s financial page.
Similarly, if a user is viewing their global task list (for all of their assigned cases), the radar widget can be configured to show a data report related to the task list.
Dashboards can be created for the Workbench Portal (i.e. a User’s summary of their work) or the Work Item Portal (i.e. an in-depth view of a specific case or work item).
For example – the Accounts department may need a dashboard related to a high level view of the company financials across all cases. Alternatively, they may need a dashboard for a financial over of a specific case, or a specific segment of cases.
Fully embed your reports into ShareDo, with direct integration. This means that the reports are not just static data – they are fully interactable and clickable from within the ShareDo platform.
For example, clicking a case shown on a Power BI report, will open that case view directly.
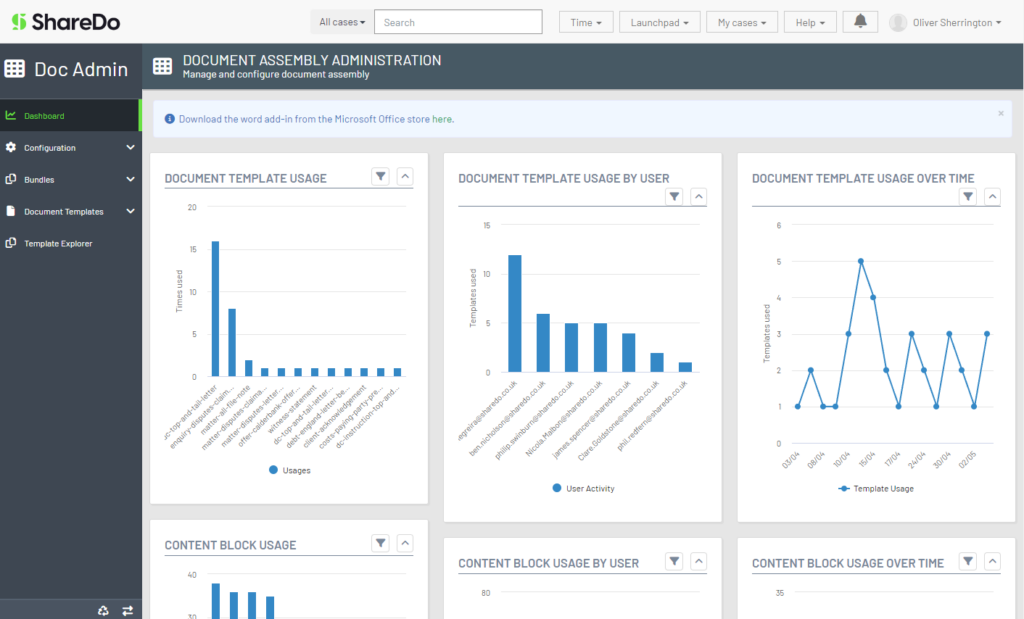
Within the admin areas of the ShareDo system you can view aggregated reports based on the actions that users are taking most or least regularly.
For example – in the document admin portal (see right), you can see which documents are being used most often and by who, in order to deep dive your operational processes and laser focus on the areas that will generate the most impact.
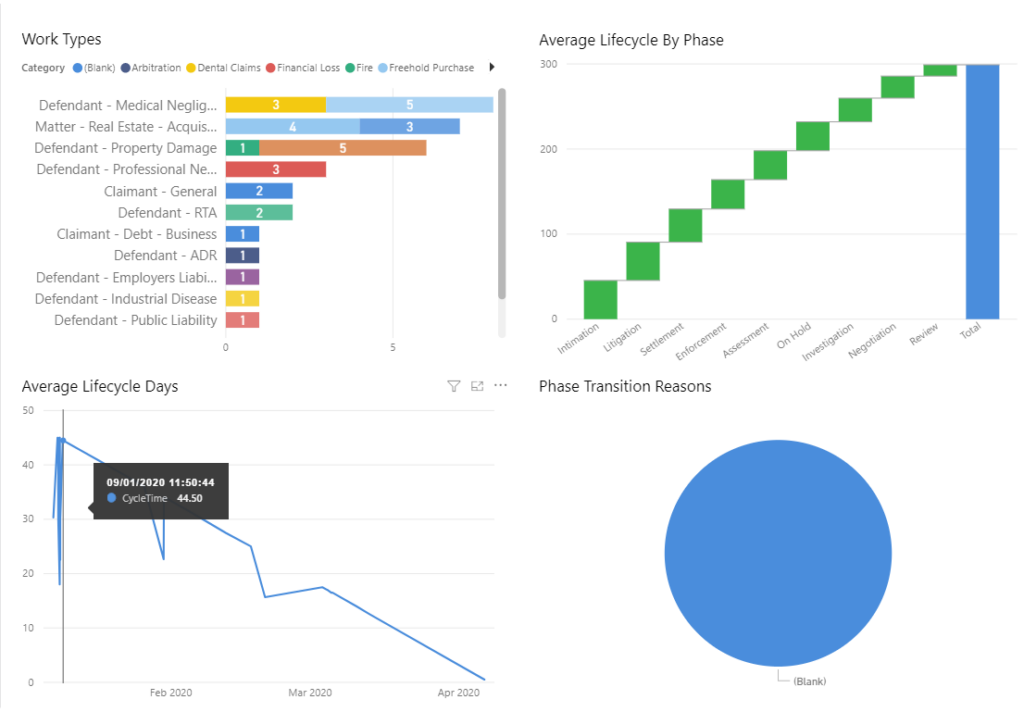
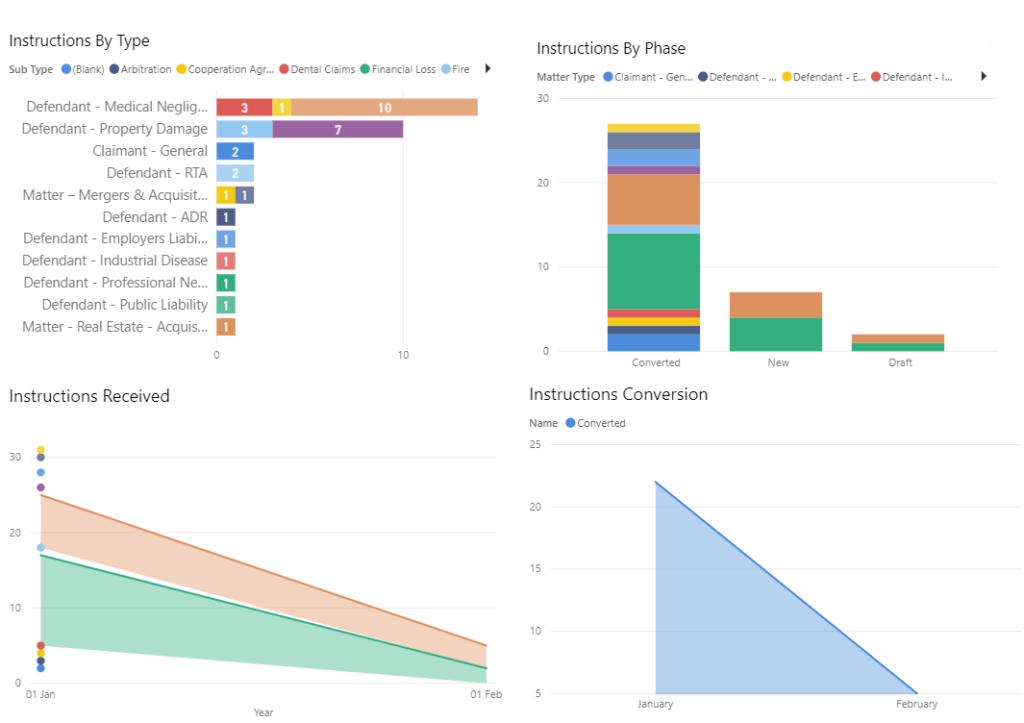
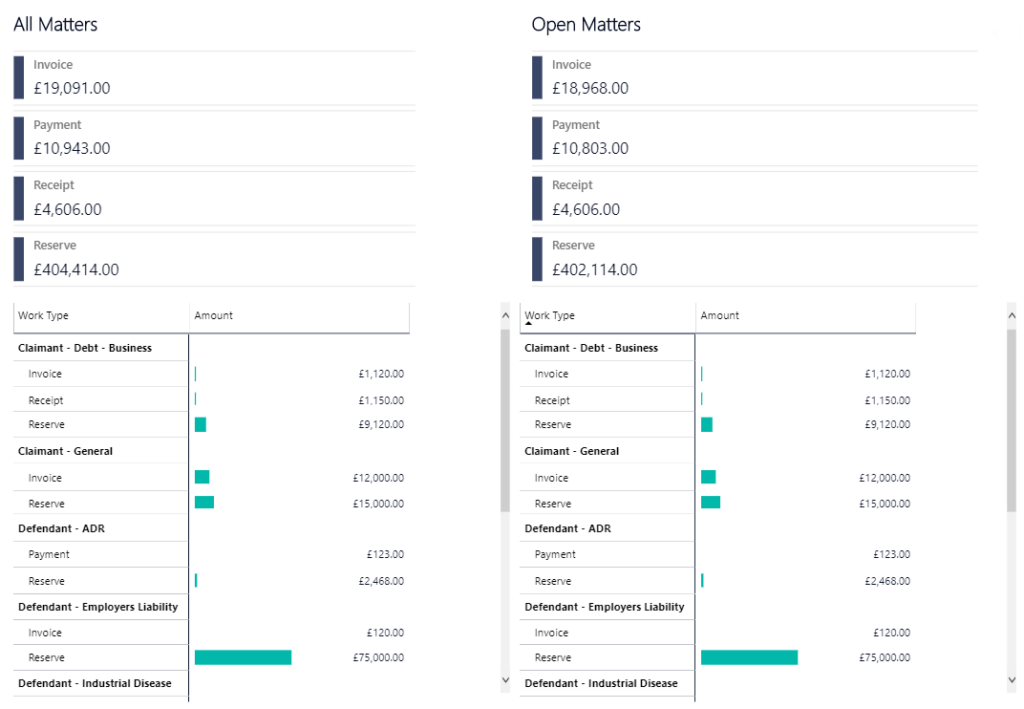
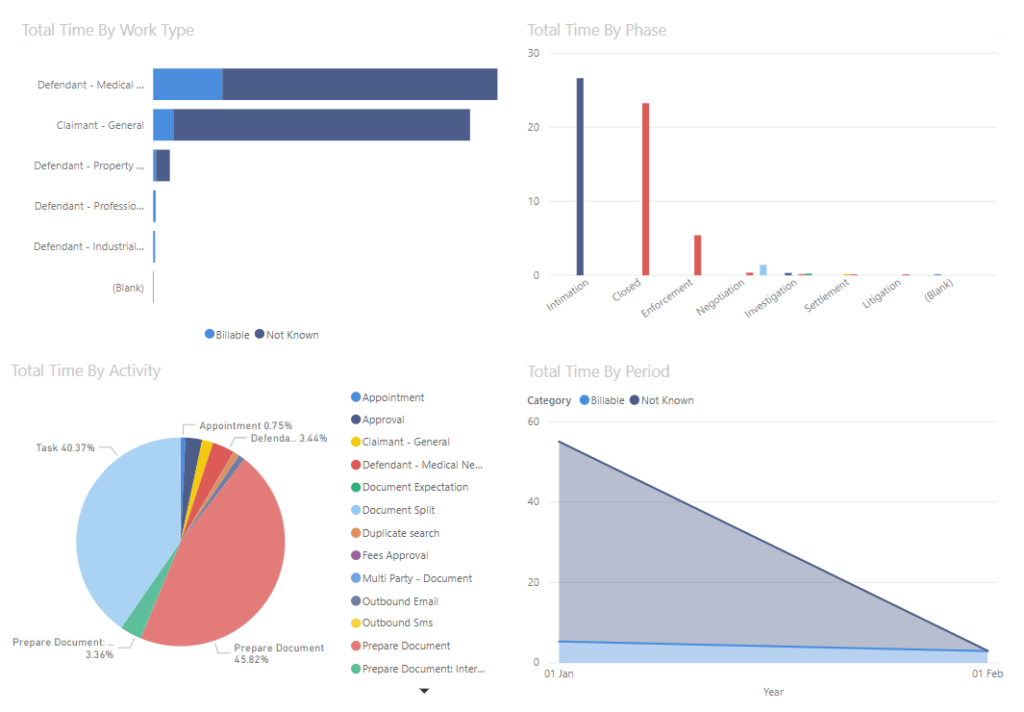
ShareDo comes with a large number of pre-built Power BI reports to help your organisation get started measuring the most important metrics quickly. A small selection of examples are below:
Our database is built using something called Elastic Search technology. This modern methodology allows for near real-time reporting – and when we say near real-time we mean with a c. 200ms delay. Importantly, this technology also means that data reporting is delivered extremely quickly, and without any slowdown caused by large data sizes.
Yes – ShareDo’s extensive persona engine means that you have extremely fine control of the information that gets reported to different users. For example – you may wish for case handler in one department to see certain information, but hide that same information to case handlers in a different department. Or even, allow case handlers to see data from one client, but hide that same type of data of another client. The persona engine puts you in the driver seat for near limitless reporting customisation options.
No – there are no reporting limits or additional costs whatsoever.
Power BI uses various methods to send data to the online Power BI Service. We recommend using Enterprise Gateway or ExpressRoute for most scenarios; however, for clients where data security policies do not permit the hosting of their warehouse data outside of their environments, we can also use Direct Connection with Analysis Services Gateway.
Data within Power BI is held in line with Microsoft Online Services Terms. Currently, data is held in Microsoft’s Dublin data centre with a backup node in the Netherlands; however, this is shortly due to change to a UK-based data centre (https://azure.microsoft.com/en-us/regions/).
The following link gives an overview of Power BI Security and contains a detailed whitepaper on all aspects of Power BI security implications and architecture.